06. Appen's Data Annotation Platform
Data Annotation
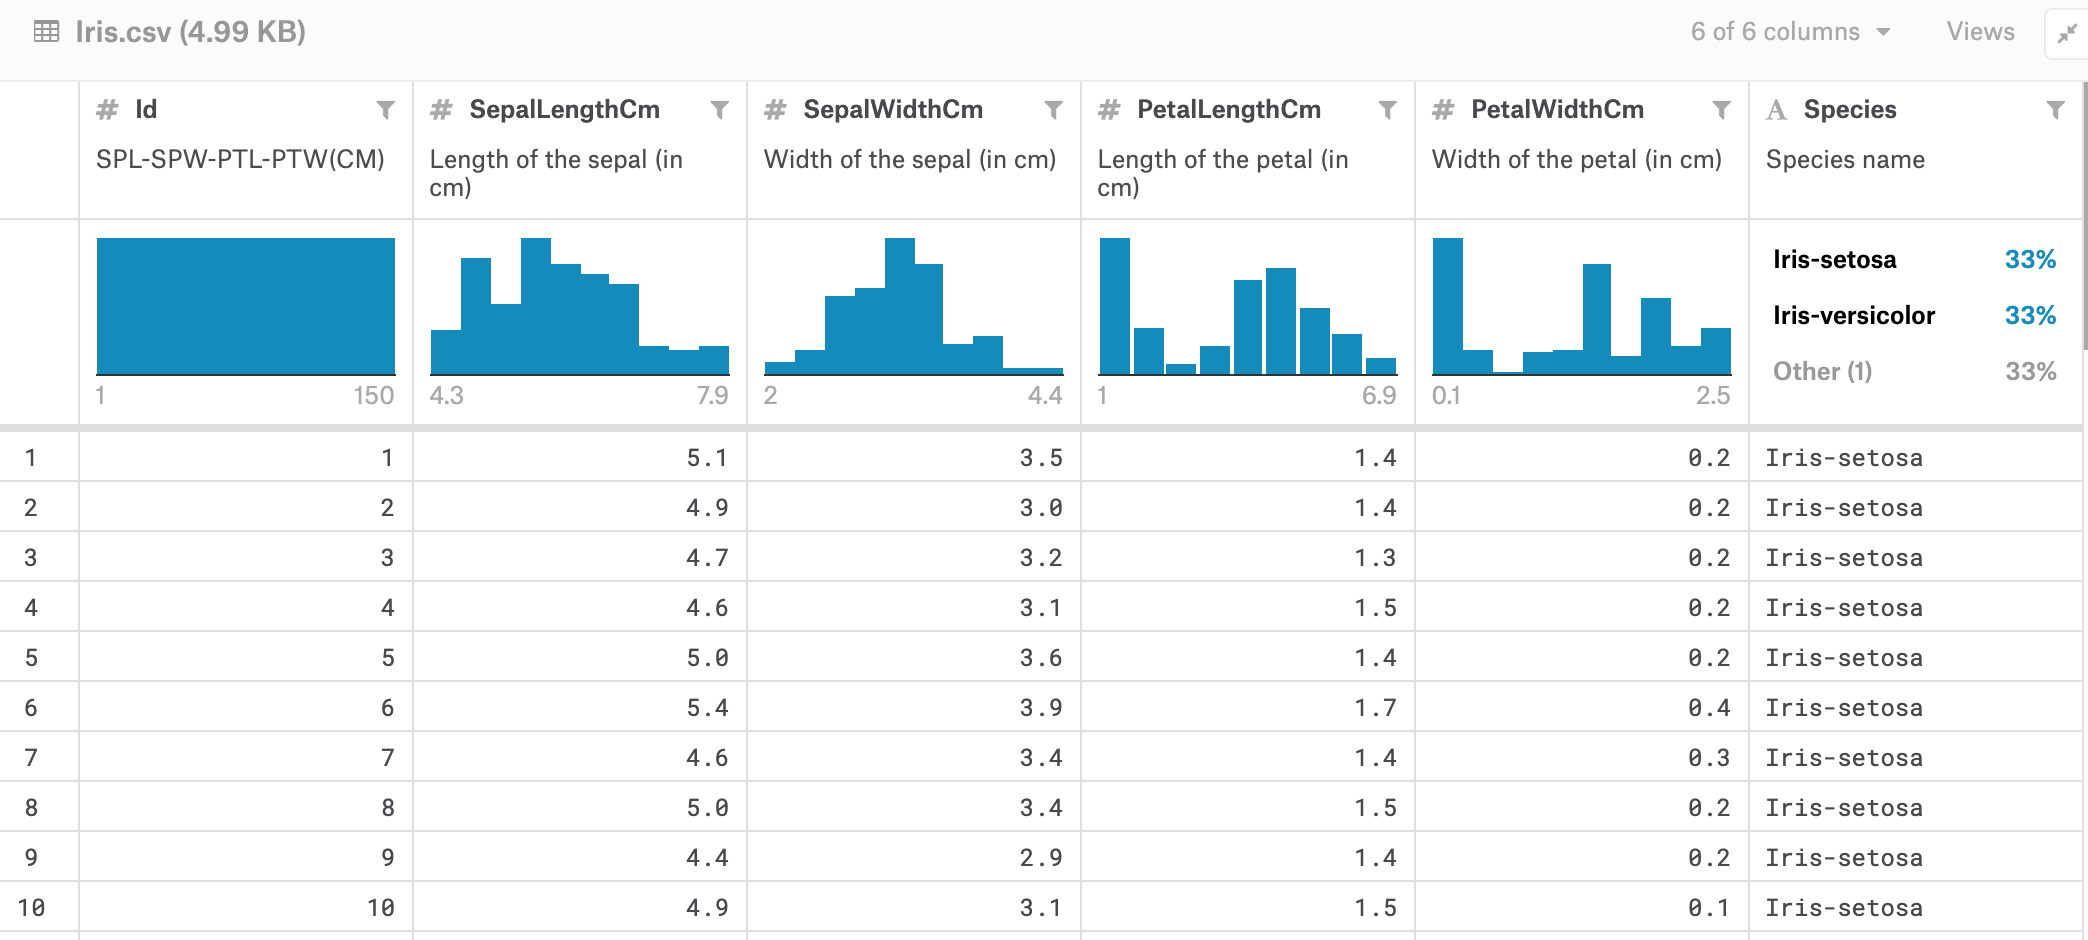
If you look at different datasets used for training machine learning models; they often come in a tabular format—a file that contains a bunch of information about different data points (often a .csv spreadsheet). An example showing both the distribution—how many data points fall into which column ranges—and the different features, such as petal length and width, of different species of Iris, is shown below. You can check out the original data source on Kaggle.
The species labels and features have been recorded by scientists/annotators.
Adding Annotations via a Platform
To annotate a new data source that perhaps only includes images of flowers and no other identifying labels or features, you'll have to a data annotation platform. These platforms will send unlabeled data to some human annotators who can classify or provide features for the data and send it back to you in a tabular format.
Some cloud service providers like AWS provide data annotation services as do specific companies; data annotation tooling is what the company, Figure Eight does and so we will use their platform as an example, but the skills you learn here about designing labels and creating a dataset will be applicable, across different platforms.
As of April 16, 2020 Appen fully integrated Figure Eight in its solution offering. Any references to Figure Eight's platform in the classroom now refer to Appen's platform.
Learn more on www.appen.com.
Platform
The best way to learn about Figure Eight's data annotation tools is to explore the platform homepage. Here, you will see examples of use cases for labeling text, speech, image data, and more!
The goal of data annotation is to bring you from unstructured, unlabeled data, to a desired, labeled output. Figure Eight will send your data to human annotators that can help transform unlabeled data.
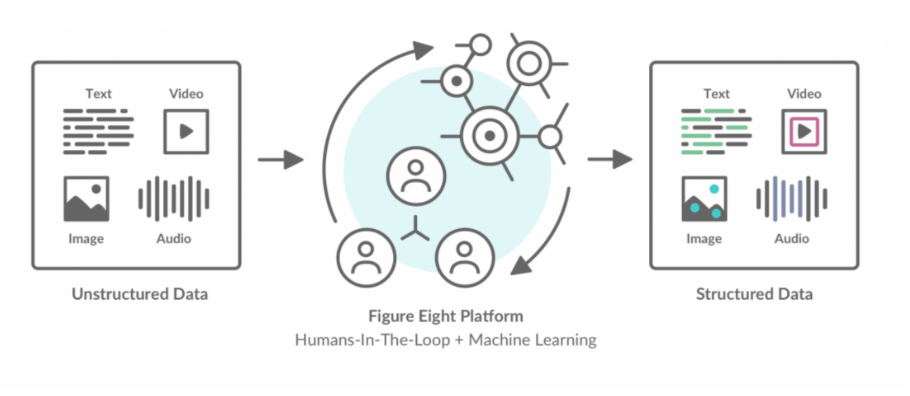
From unstructured to structured data
Creating an Appen Account
You can create an Appen account by going to their Client Workspace homepage and creating an account for yourself.
As of 11am PT April 28th, 2020, Appen platform allows students to create an account using their personal email address.
Please write down this email address and password as you will need it to reset your login. The login settings will be changing in the week of April 27th, 2020 and it is important you have these login email and password handy.
The next few videos will include a walkthrough of this platform and you are encouraged to explore this platform with some sample data of your own. Or using the data provided in the link, below.
- This dataset, a csv file is for
Sentiment Analysis: given some tweets about Airline performance, can you create a job that labels tweets as positive or negative?
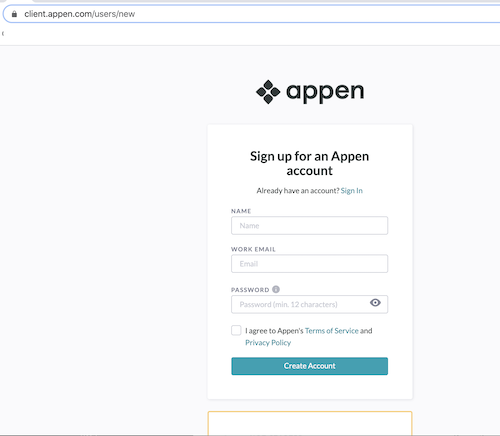
This should bring you to a pop-up where you can enter a password and email of your choice to create an account! (You can use a personal email to register.) You will have to agree to their terms of service to sign up.
The Job Creation Page
Soon after signing up, you should get an introductory email from Figure Eight and be directed to the main job creation page where you can see a variety of common labeling jobs to explore and create.
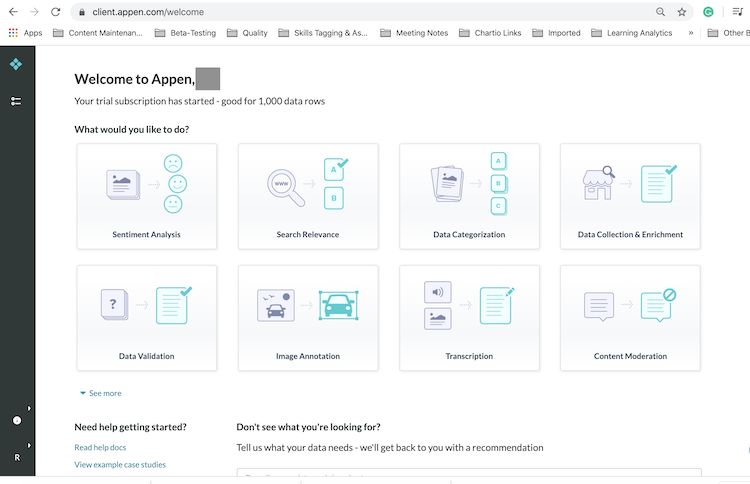
Appen Job Creation page
At this point, I'd suggest clicking on a job type that interests you and selecting the Preview option to see a variety of different templates and annotation instructions.
Case Study: Parking Sign Classification
Next, you'll see how to create and monitor a data annotation job that aims to identify parking signs in different city images.
Example case study:
- This example is based off of a publicly available, richly-labeled dataset of parking signs.
- The example aims to label images as yes or no with respect to containing a parking sign
Publicly available data:
- The richly-labeled dataset involves a combination of image annotation (drawing boxes around the parking signs) and multiple labels that specifically labeled the signs into categories like No parking, Tow zone, etc.
- The richly-labeled dataset is free for public use and exploration.
- The complete data is great for exploring, but a bit complex for an educational example; you are encouraged to read about the design of the labeling job and even explore other datasets, as you learn. This may be especially useful if you have a product or some data in mind that you want to work with.
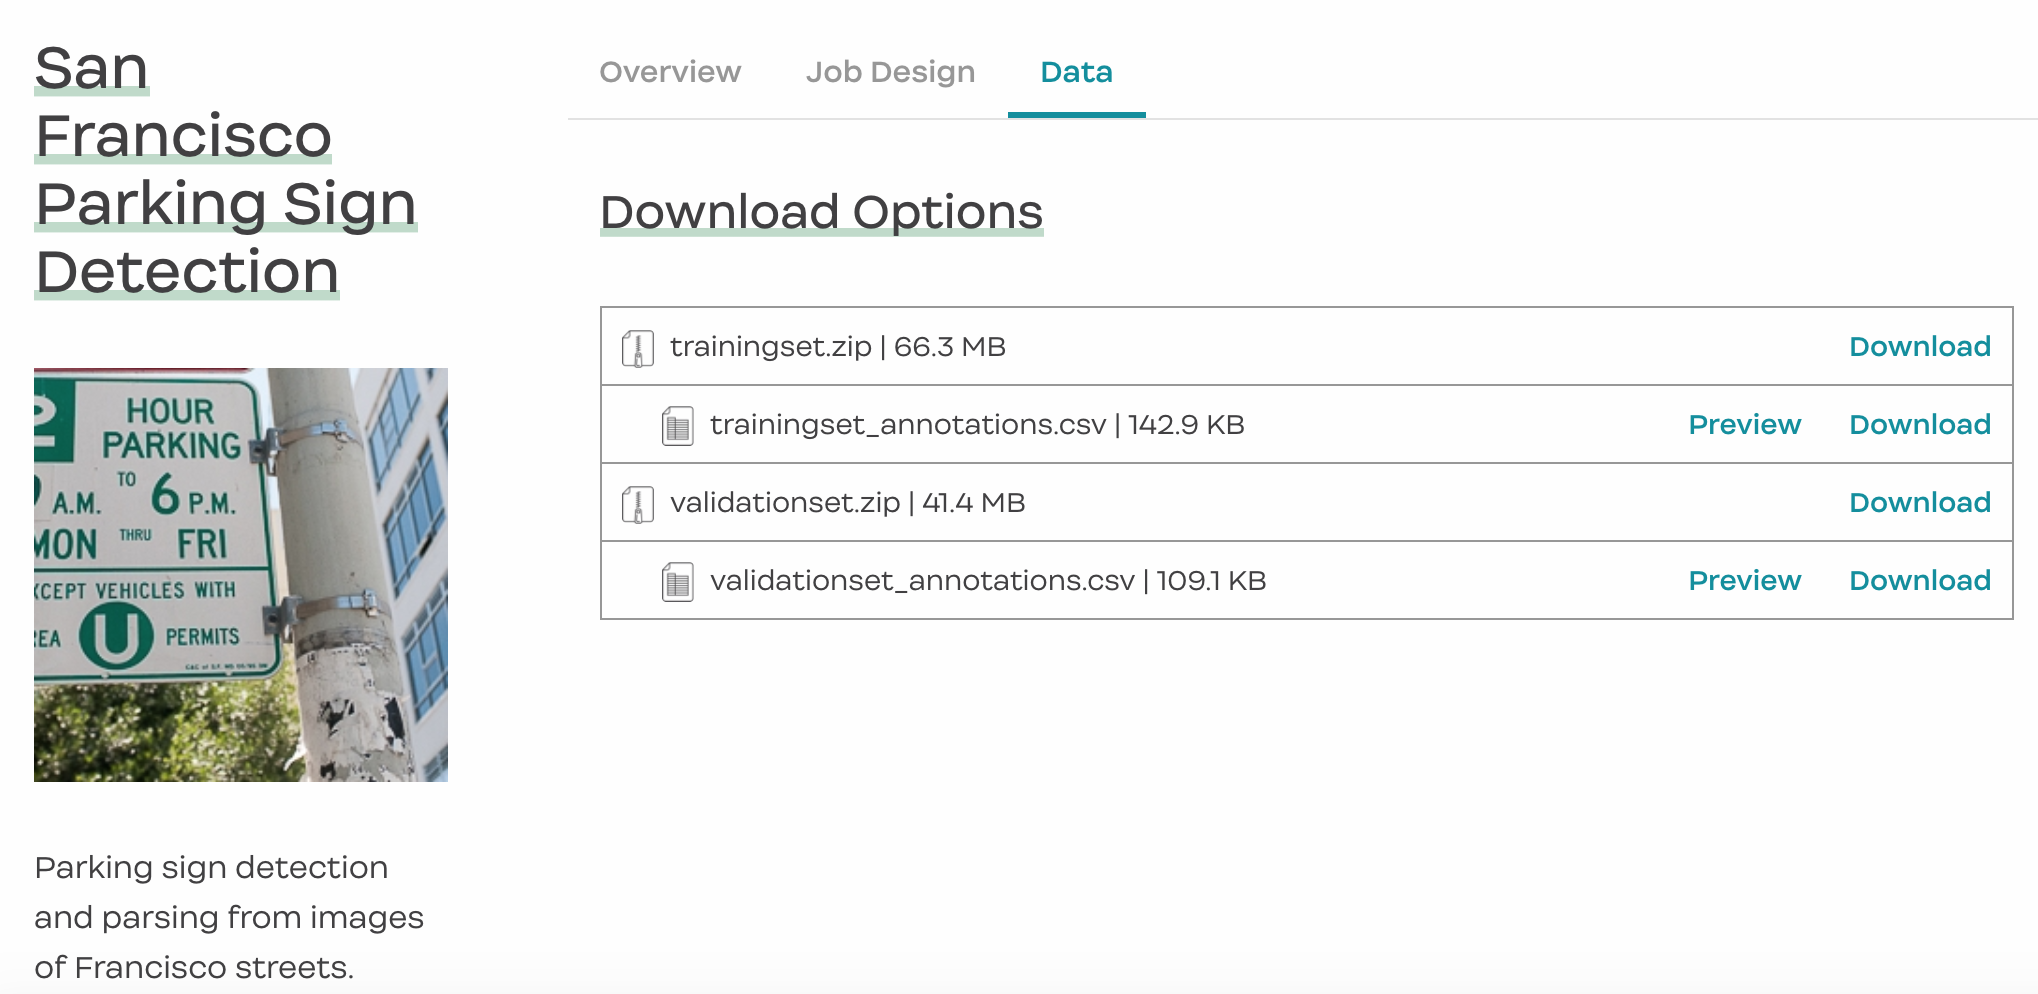
Find this dataset, at this link.
Fun fact: It was initially developed by a team who wanted to avoid getting parking tickets in San Francisco!